
How to Trade the Opening Range Breakout (ORB) Strategy Effectively
A practical guide to the Opening Range Breakout (ORB) strategy: how to identify the range, set entries, and manage risk to avoid fakeouts.

The Opening Range Breakout (ORB) is an intraday trading strategy that focuses on the price action during the first few minutes of a market session. By identifying the high and low of this initial period, traders attempt to capture the dominant trend of the day as it breaks out from this range.
What is the Opening Range Breakout (ORB) Strategy?
The orb trading strategy is based on the premise that the first few minutes of the trading day contain the highest concentration of institutional volume and volatility. When the market opens, a surge of orders from overnight news, earnings reports, and institutional repositioning creates a volatile price window. This initial period defines a range that often serves as a roadmap for the rest of the session.
Traders monitor the opening range high and the opening range low to determine the market’s sentiment. A break above the high suggests bullish momentum, while a break below the low indicates bearish control. Because these levels are observed by many market participants, they often act as psychological triggers, leading to rapid price movements that can be exploited for quick intraday gains.
How to Identify the Opening Range High and Low
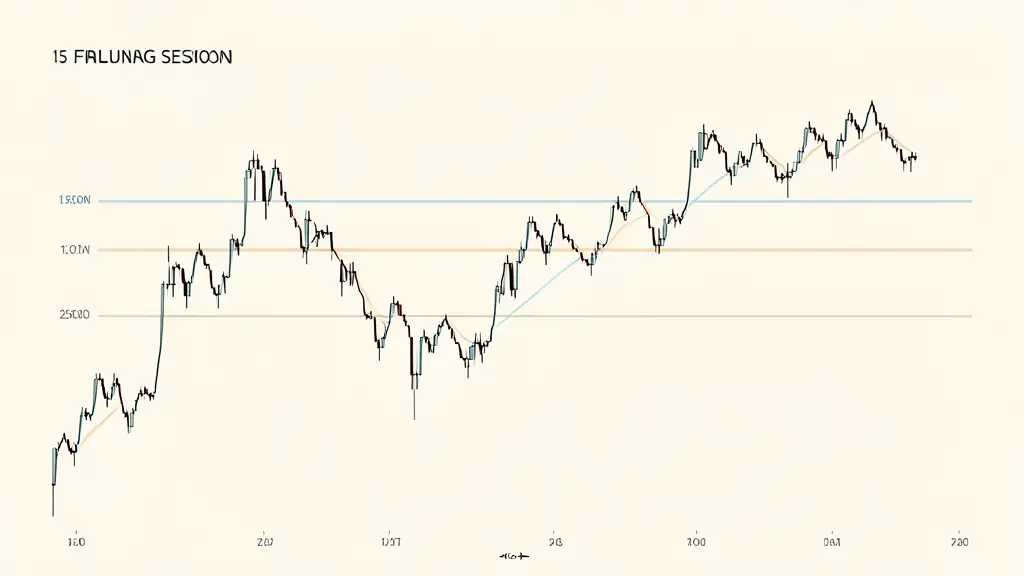
Identifying the boundaries of the opening range requires a disciplined approach to Price Action. The process begins by selecting a specific timeframe, typically the first 5, 15, or 30 minutes of the trading session.
To determine the range, follow these steps:
1. Wait for the chosen timeframe to elapse (for example, the first 15 minutes after the bell).
2. Identify the highest price reached during this period (the range high).
3. Identify the lowest price reached during this period (the range low).
4. Plot these two levels on your chart as horizontal lines.
These boundaries now serve as your trigger points. According to standard breakout trading rules, the range is considered “set” once the timer expires. Any price movement that penetrates these levels thereafter is viewed as a potential breakout, provided it is supported by momentum and volume.
Executing the Trade: Entry and Exit Rules
Execution depends on the direction of the break and the confirmation of the trend. Success in this strategy requires a strict adherence to entry and exit parameters to manage trading volatility effectively.
Bullish Breakout (Long)
- Entry: Enter a long position when a candle closes above the opening range high.
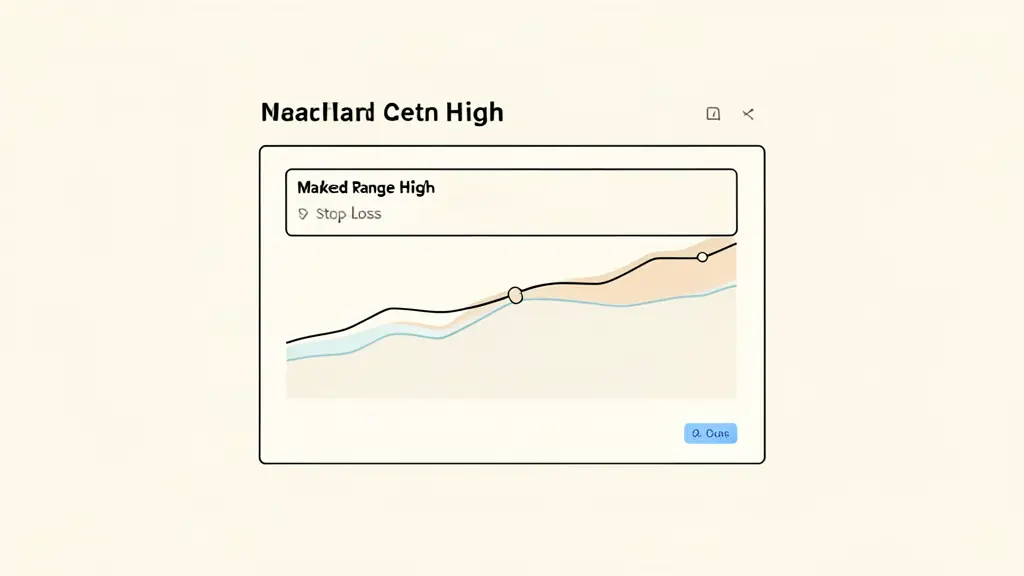
- Stop-loss: Place the stop-loss at the mid-point of the opening range or, for a more conservative approach, at the opening range low.
- Target: Set profit targets based on a fixed risk-reward ratio (e.g., 1:2) or the next major level of Support and Resistance.
Bearish Breakout (Short)
- Entry: Enter a short position when a candle closes below the opening range low.
- Stop-loss: Place the stop-loss at the mid-point of the opening range or at the opening range high.
- Target: Use the same risk-reward logic or target the nearest support zone.
To avoid entering a trade too late, traders often use limit orders slightly above the high or below the low, although market orders upon a candle close provide more confirmation.
Choosing the Right Timeframe for Your Range
The choice of timeframe significantly impacts both the frequency of trades and the reliability of the signal. Shorter ranges provide more opportunities but are prone to noise, while longer ranges offer more stability at the cost of fewer setups.
| Timeframe | Trade Frequency | Reliability | Best For |
|---|---|---|---|
| 5 Minutes | High | Low | Scalpers / Aggressive traders |
| 15 Minutes | Medium | Medium | Balanced Intraday traders |
| 30 Minutes | Low | High | Conservative / Swing-style traders |
Using a 30-minute range often acts as a natural false breakout filter, as it allows the initial “opening noise” to settle, ensuring that the subsequent move is backed by a more sustainable trend.
Protecting Your Capital from False Breakouts
A False Breakout occurs when the price breaches the range high or low only to reverse sharply, trapping traders. To protect your account, especially when applying funded account risk management, you must implement confirmation filters.
- Volume Confirmation: A valid breakout must be accompanied by a significant increase in Trading Volume. If the price breaks the range on low volume, it is likely a trap.
- The Candle Close Rule: Never enter a trade while the candle is still moving. Wait for the candle to close outside the range. This ensures the breakout is not just a “wick” that immediately retreats.
- Candlestick Patterns: Look for bullish or bearish engulfing patterns at the range boundary to confirm that the momentum is genuine.
By combining volume and price confirmation, you reduce the probability of being liquidated by a sudden reversal.
ORB Risk Management for Funded Accounts
For traders using prop firm accounts, the primary goal is not just profit, but the preservation of the account. The biggest risk with the ORB strategy is the “whipsaw,” where a trader is stopped out on both the long and short side in a single session.
To avoid breaching your daily drawdown limit, you must calculate your position size based on the distance between your entry and your stop-loss.
Concrete Numerical Example:
Suppose you have a funded account with a daily drawdown limit of $1,000. To ensure one failed ORB trade does not jeopardize your account, you might decide to risk only 0.5% of your daily limit per trade, which is $50.
If the opening range is 10 points wide and you place your stop-loss at the opposite end of the range:
* Risk per trade: $50
* Stop-loss distance: 10 points
* Position Size: $50 / 10 points = 5 units (or contracts) per trade.
By fixing the monetary risk rather than the contract size, you ensure that even a total loss on the trade remains well within the prop firm’s safety parameters. This discipline prevents a single volatile morning from ending your funding journey.
This article does not replace advice from a qualified professional: consult a specialist about your own situation.
Risk warning. Trading involves a risk of losing capital. Prop firm challenges are paid and passing them is not guaranteed. This content is for information only and is not investment advice.

Morgana Martel analyse les prop firms, leurs règles et leurs programmes de financement afin d’aider les traders à faire des choix éclairés. Elle partage des comparatifs transparents et des conseils pratiques pour aborder les challenges avec méthode et confiance.
Want to go further?
Leave your email and we'll let you know when a new article is out.